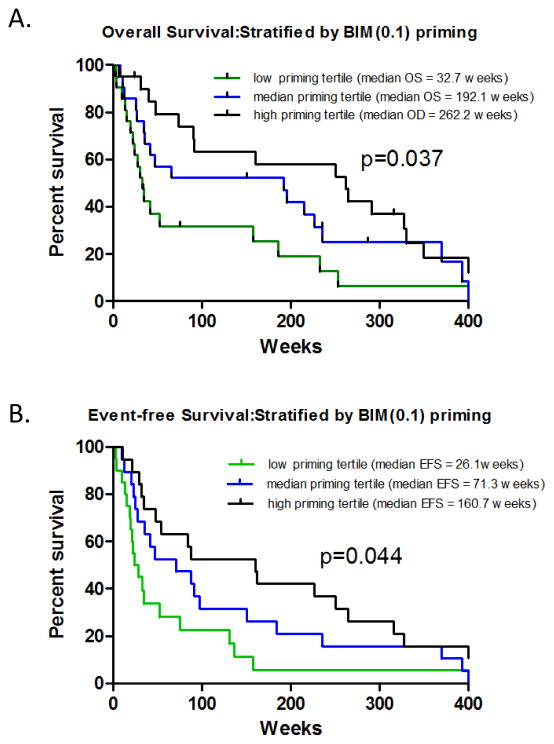
Figure 4. OS and EFS vs. AML Patients Subgrouped by BIM % Priming Tertiles.
AML patients were stratified by low, medium, and high BIM % priming scores and then analyzed for OS (panel A) and EFS (panel B). Logrank analyses indicates borderline significant associations between OS and BIM(0.1) priming (p=0.037), and EFS and BIM(0.1) priming (p=0.044). For OS, low, medium, and high priming tertiles comprised 19, 18, and 18 patients respectively (total n=55 for which OS data was available; patients who received stem cell transplant were censured). For EFS, low, medium, and high priming tertiles comprised 20, 20, and 21 patients respectively (total n=61 for which EFS data was available).

