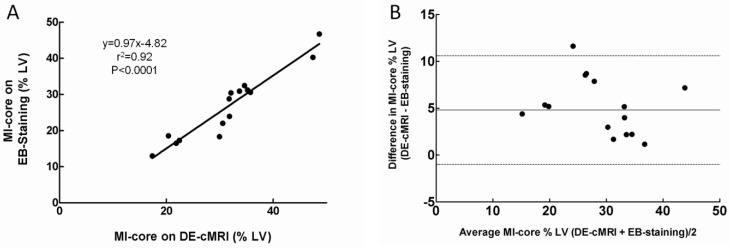
Figure 3.
Correlation of MI-core determined by DE-cMRI and EB-staining. A: Plots of linear regression analysis on MI-core determined by DE-cMRI versus EB staining. B: Plots of Bland-Altman analysis on the differences between the methods against their means: horizontal lines represent limits of agreement between DE-cMRI and EB-staining evaluations of the MI-core.

