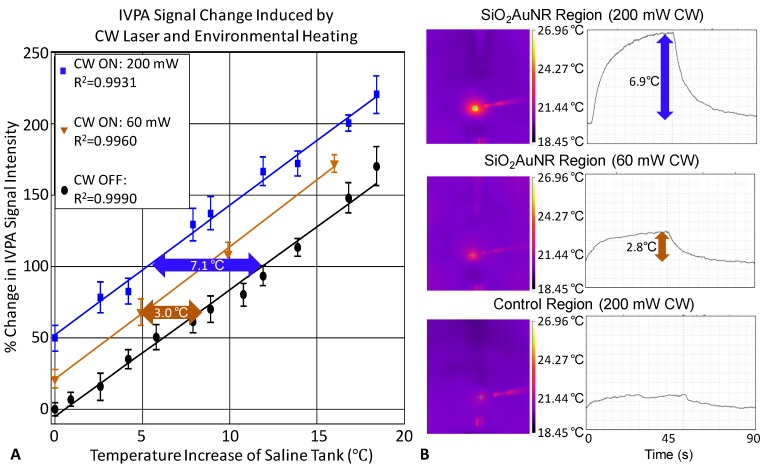
Fig 5.
Confirmation of IVPA temperature monitoring during heating of SiO2AuNR on a human right coronary artery ex-vivo. (A) The percent IVPA signal change versus relative baseline temperature are plotted in the absence of CW laser heating (black), and following CW laser heating of the SiO2AuNR inclusion using output energies of 60 mW (orange) and 200 mW (blue) from the integrated IVUS/IVPA imaging catheter. (B) FLIR thermal images and temporal profiles of surface temperature rise of the SiO2AuNR inclusion exposed to 200 mW (top) and 60 mW (middle) CW laser heating and a control region of the artery exposed to 200 mW CW laser heating (bottom).

