Fig 1.
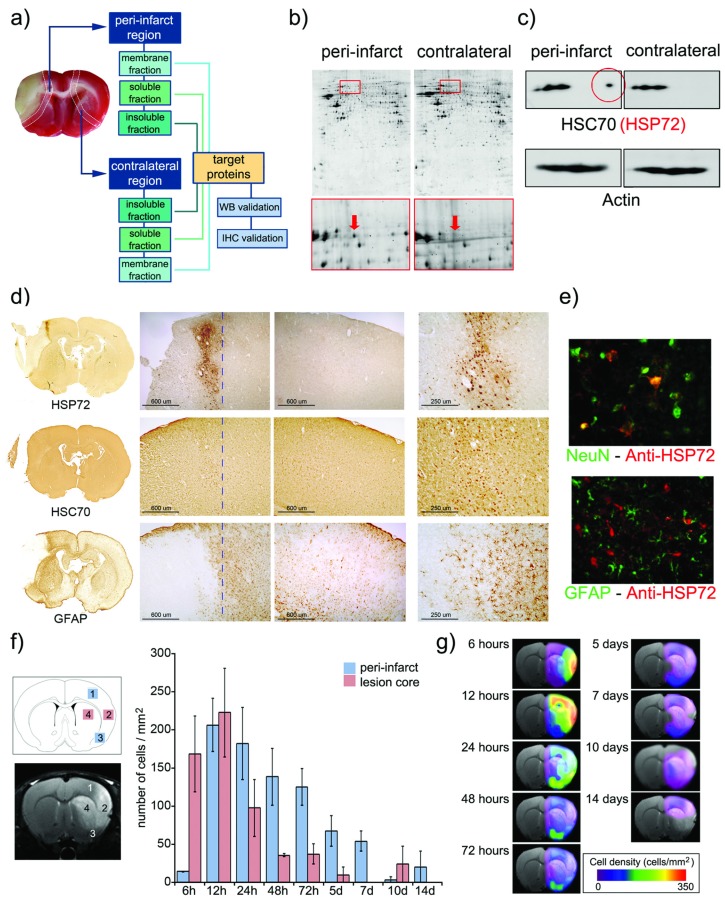
a) Infarct core of a section of an ischemic rat brain stained (in beige) by tetrazole chloride. A 2 mm strip around this area (dotted line) and a mirrored contralateral section were selected as peri-infarct and control tissues, respectively. Following tissue disaggregation, proteins were isolated in 3 fractions (insoluble, soluble and membrane proteins). 2D-PAGE analysis was performed, and proteins over-expressed in the peri-infarct tissue were evaluated by Western blot (WB) and immunohistochemistry (IHC). b) Proteomic gels showing the expression of peri-infarct and contralateral proteins (spots) with magnification (red frames) of the region where HSP70 proteins is located. c) 2D-WB results showing (top row) that HSP72 (circled in red) is the only member of the HSP70 family specifically expressed at the peri-infarct tissue, while other members of the family are also expressed in contralateral tissues (actin bands used for protein load control are also shown). d) Immunohistochemical (IHC) study of consecutive brain slices (10 µm) stained for HSP72 (top-row), HSC70 (middle-row) and GFAP (bottom-row). Left-to-right columns: complete brain slices, 4X magnifications of the ischemic and contralateral hemispheres, and a 10X magnification of the peri-infarct region. e) Double fluorescence IHC of peri-infarct tissue. HSP72 (red) is mostly expressed by neurons (NeuN green, top) but not by astrocytes (GFAP green, bottom), 48 h after ischemia. f) Temporal profile of HSP72 expression in the ischemic brain. Regions selected for cell counting analysis are indicated in the MR image (where infarct core appears hyper-intense). g) Color-coded density maps (overlaid on MR images) presenting the spatiotemporal expression profile of HSP72 in the ischemic brain.

