
Figure 2.
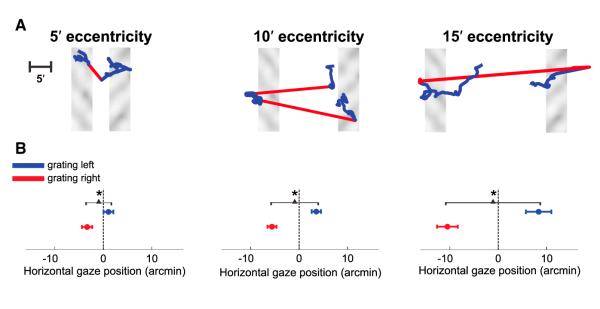
Gaze Location in Normal, Unstabilized Trials
(A) Examples of fixational eye movements. Red and blue segments represent microsaccades and drifts, respectively.
(B) Average horizontal position of the center of gaze during presentation of each of the two gratings.
In both (A) and (B), different panels show data obtained with stimuli at different eccentricities. Error bars represent SEM. Asterisks mark significant differences (p < 0.05; two-tailed paired t test). The center of gaze is defined in this study as the point on the screen projecting onto the center of the preferred retinal locus of fixation. This point was estimated by means of a preliminary calibration procedure, in which the observer maintained prolonged fixation on markers at known positions on the display. See also Figure S3 and Movies S1, S2, and S3.