
Figure 3.
Microsaccades and Gaze Position in the Normal Condition
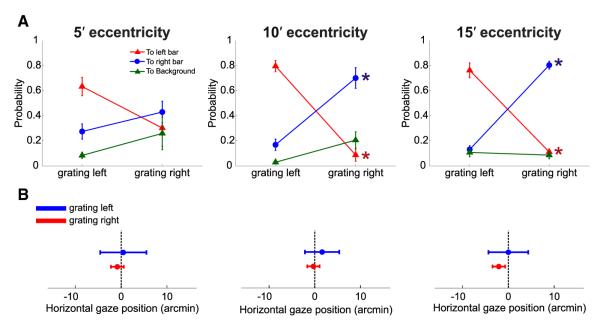
(A) Proportions of microsaccades landing on one of the two bars and on the background region during the two periods of grating presentation. Microsaccades were more likely to relocate the preferred retinal locus of fixation on the bar currently displaying the grating than anywhere else. Error bars represent SEM. Asterisks mark significant differences between the probabilities of landing in a given region of the image in the two temporal intervals (p < 0.01; two-tailed paired t test).
(B) Average horizontal gaze position during presentation of each of the two gratings (same data as in Figure 2B) after removal of the microsaccades from the recorded eye movement traces. Drift segments for the entire trial duration were concatenated by subtracting all microsaccade displacements, so that the gaze position of the first sample after a microsaccade was made equal to that of the last sample before the microsaccade. Error bars represent SEM.