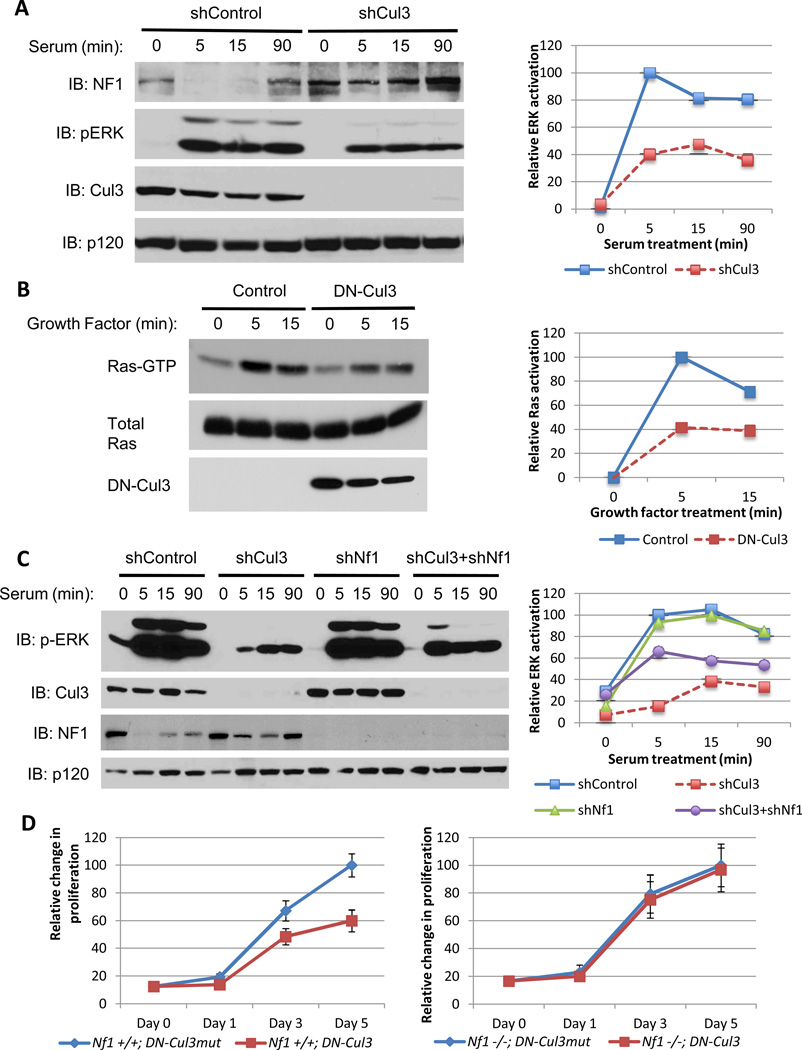
Figure 3. Cul3 loss suppresses Ras/ERK signaling and proliferation.
A) Left, immunoblot of neurofibromin, phosphorylated ERK, Cul3 and RasGAPp120 from serum-stimulated NIH3T3 fibroblasts expressing a lentiviral control shRNA or a Cul3-specific shRNA. Right, quantification of relative levels of activated ERK in shControl or shCul3-expressing cells using image j software.
B) Left, immunoblot of a Ras-GTP pulldown assay to assess activation of Ras in mouse embryonic fibroblasts expressing a lentiviral control vector or dominant-negative Cul3 (DN-Cul3) following treatment with LPA for the times indicated. Right, relative levels of Ras activation quantified using image j software and depicted as a percent of maximal Ras activation compared to vector control-expressing cells.
C) Left, immunoblot of phosphorylated ERK, Cul3, neurofibromin, and RasGAPp120 from NIH3T3 fibroblasts expressing lentiviral control vectors or Cul3 and NF1-specific shRNAs individually or in tandem. Right, quantification of relative activated ERK levels using image j software, denoting that the attenuation in ERK activation due to Cul3 deficiency is rescued in part by the ablation of Nf1 expression.
D) Relative proliferation curves of NF1 wild-type (Nf1+/+) or NF1-null (Nf1−/−) mouse embryonic-fibroblasts expressing a dominant-negative Cul3 (DN-Cul3) or an inert mutant form of this construct (DN-Cul3mut) as a control. Error bars represent the standard deviation (SD) of triplicate cell number measurements.

