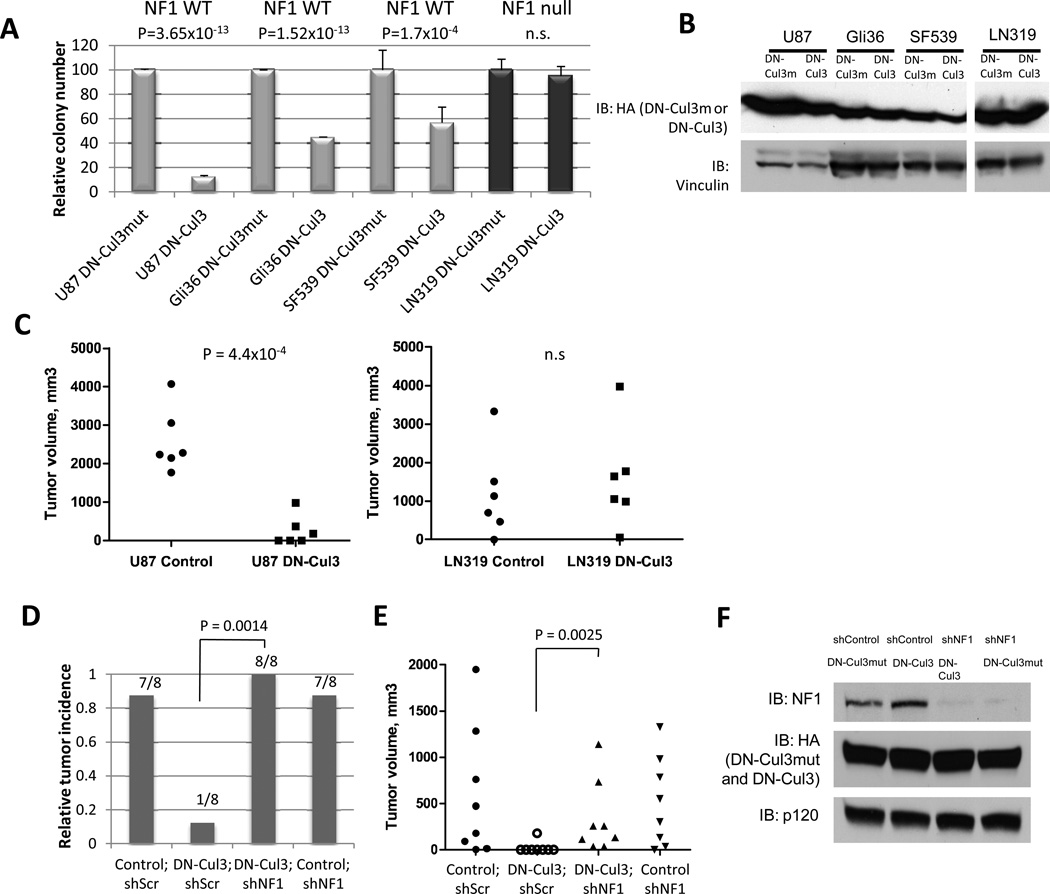
Figure 5. DN-Cul3 suppresses transformation and tumor growth through its effects on neurofibromin.
A) Relative differences in soft agar colony growth of NF1-WT (U87, Gli36, SF539) or NF1-null (LN319) GBM cells expressing DN-Cul3 or an inert mutant (L52AE55A)control (DN-Cul3mut). Data are represented as mean ± SD of triplicate measurements. P-values shown in the panel were calculated by Student’s t-test. n.s.: not statistically significant.
B) Immunoblot showing equivalent loading of DN-Cul3 and DN-Cul3mut in each GBM cell line used for soft-growth agar assays and xenograft injections shown in Fig. 5A. and Fig. 5C. Vinculin levels are shown as loading control.
C) Dot plot depicting differences in tumor volume in xenograft tumor-bearing mice injected with U87 or LN319 cells expressing DN-Cul3 or a (L52AE55A)DN-Cul3mut control (same cells as in A). P-value significance in the panel was determined by Student’s t-test. n = 6 each. n.s.: not statistically significant.
D) Relative tumor incidence of U87-shp53 GBM cells expressing DN-Cul3 or a control DN-Cul3mut (L52AE55A)vector in conjunction with a lentiviral NF1 shRNA or a control shRNA. Bars represent the fraction of tumor incidence over a period of 5 months and the number of tumors formed/number of injections are depicted. n = 8 in each category. P = 0.0014 (DN-Cul3;shScr versus DN-Cul3;shNF1) using Fisher’s exact test.
E) Dot plot depicting tumor volume in xenograft-tumor bearing mice injected with U87-shp53 GBM cells expressing DN-Cul3 or the control DN-Cul3mut (L52AE55A)vector together with a lentiviral NF1 shRNA or a control shRNA. A Mann-Whitney U test (P = 0.0025) was used to illustrate a significant difference in tumor volume in xenograft tumors comprised of DN-Cul3;shScr versus those comprising DN-Cul3;shNF1-expressing cells.
F) Neurofibromin expression in shp53-U87 cells used for xenograft studies shown in Fig. 5D and Fig. 5E. Cells express shNF1 or a control shRNA and HA-tagged DN-Cul3 or DN-Cul3mut constructs. HA immunoblot showing equivalent expression of DN-Cul3 and DN-Cul3mut is shown, as well as RasGAPp120 which serves as a loading control.

