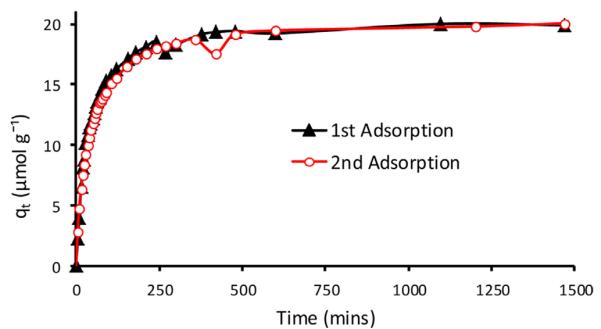
Fig. 7.

Plot of qt of adsorption of 2,4,5-TCP as a function of time by 30:20:50 CEL:CS:B15C5 composite film: Black curve is for 1st adsorption (i.e., by freshly prepared films) and red curve is for 2nd adsorption (i.e., adsorption by films that were regenerated by desorbing 2,4,5-TCP previously adsorbed). (For interpretation of the references to color in figure legend, the reader is referred to the web version of the article.)
