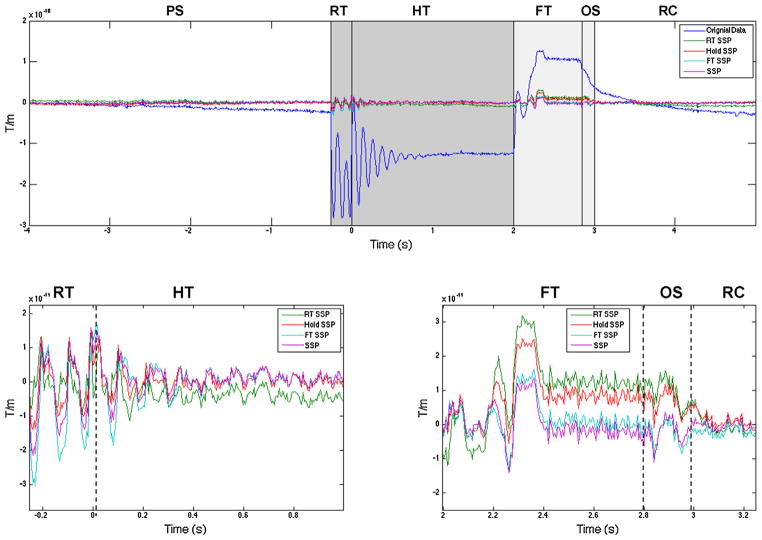
Fig. 3.
Upper plot shows the original artifact (blue) from a 9 s long averaged data from one gradiometer channel and comparison of rank 3 SSP techniques. RT SSP–SSP operator computed from just the rise phase of the CHEPS artifact, Hold SSP–SSP operator computed from hold phase, FT SSP–SSP operator computed from fall phase of the CHEPS artifact, SSP–SSP operator computed from all 6 phases of the CHEPS artifact. Lower left plot shows magnified version of SSP results from the dark gray shaded area in the upper plot (rise and hold phases). Lower right plot shows the magnified version of SSP results from the light gray shaded area in the upper plot (fall and over-shoot phase). PS – pre-stimulus, RT – rise time, HT – hold time, FT – fall time, OS – over shoot and RC – recovery.

