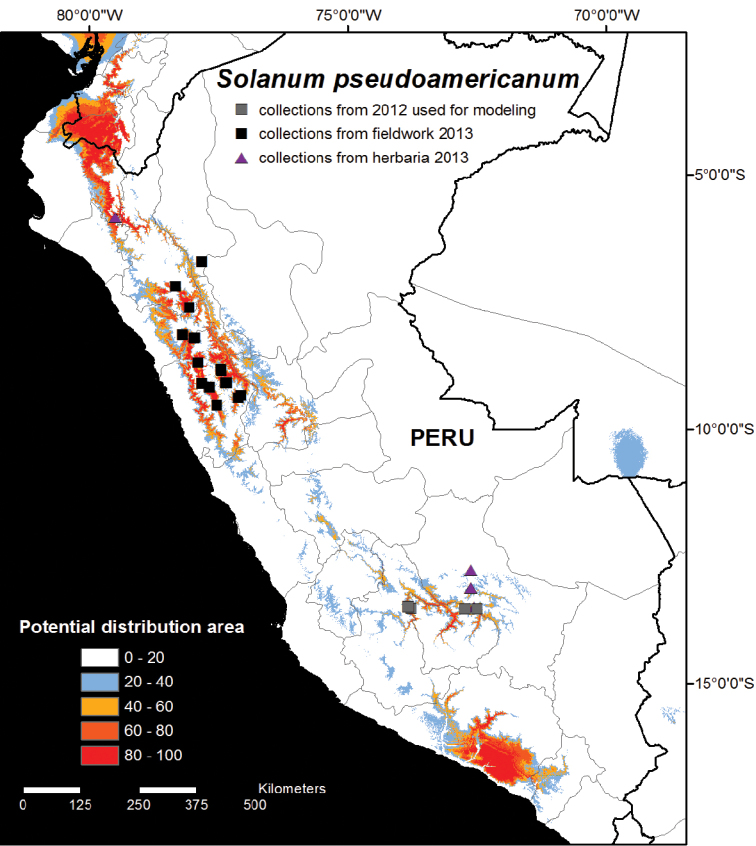
Figure 1.
Potential habitat distribution map of Solanum pseudoamericanum. The potential habitat areas reflect the cumulative output of the MAXENT model produced using 11 climatic variables with the original four collection localities from 2012 from southern Peru shown as grey squares on the map (see Methods for details). Areas identified as highly suitable (above 40% cumulative probability) in central and northern Peru were visited in 2013 during the second field season, and 17 new collection localities were found as a result (black squares). Five additional collections were identified amongst herbarium loans (purple triangles).

