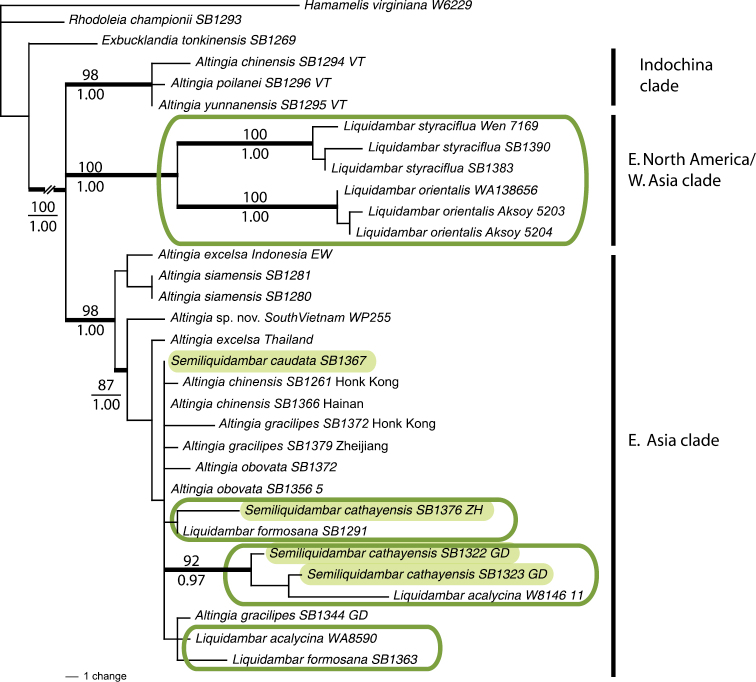
Figure 1.
Phylogenetic relationships of Altingiaceae based on maximum likelihood analyses of combined cpDNA data. Phylogram is one of 14 trees (-InL=9927.72) derived from maximum likelihood analyses showing rates of substitution under K81uf+I model of substitution evolution (Modified from Ickert-Bond and Wen 2006). Note: Break in branch lengths for the OG at left, and Semiliquidambar taxa with green shaded boxes, clades that include Liquidambar taxa have green outline boxes.

