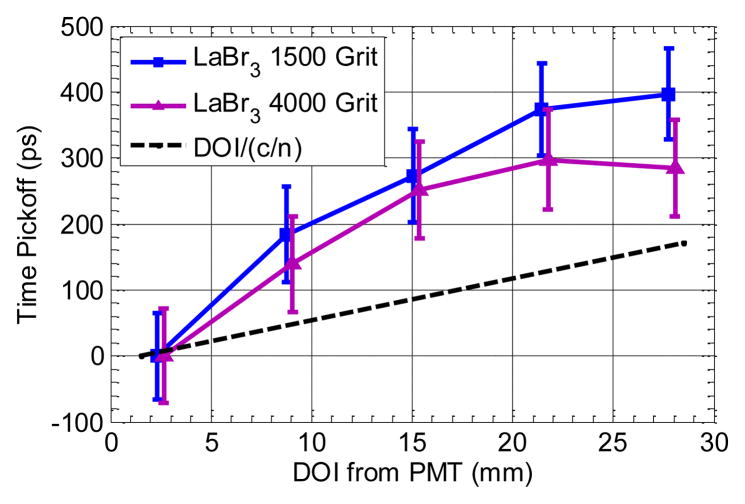
Fig. 7.
Constant fraction time pickoff vs. interaction distance from PMT (see setup in Fig. 2b). Time pickoff was measured as the centroid of the time pickoff distribution at each depth. The error bars show ±1σ of the time pickoff distribution at each depth. Expected shift in time pickoff due to scintillation photon transit time as calculated for nLaBr=1.9, as reported by the manufacturer.

