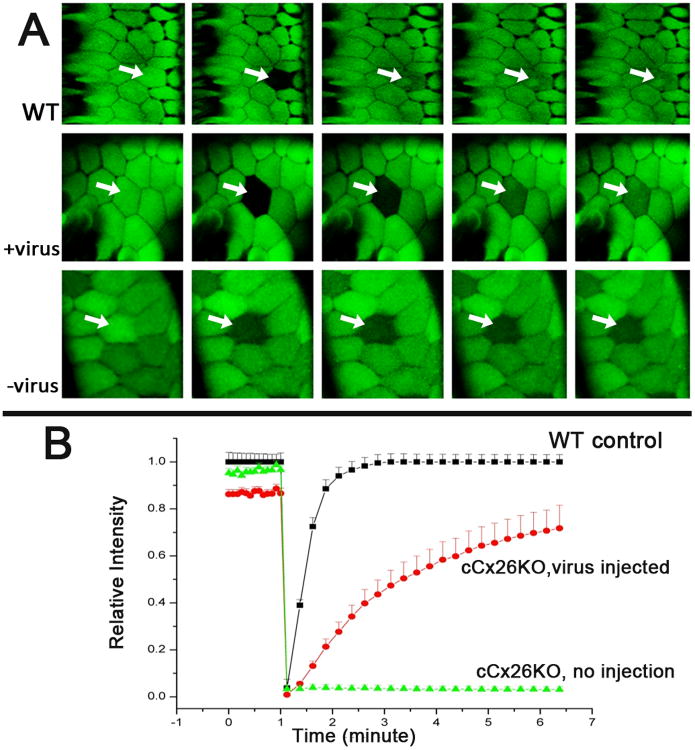
Figure 4. Results of FRAP assay for evaluating the intercellular coupling among the cochlear cells of WT, treated and untreated cCx26KO mice.
A) Time series images showing the fluorescence recovery in the photo-bleached cells (indicated by white arrows) of WT (top row), treated (middle row) and untreated (bottom row) cCx26KO mouse cochlea. Time interval of each panel is one minute. The first panel shows the outer sulcus cells loaded with calcein AM just before photobleaching. The cell pointed by the white arrow was photobleached by intense laser light for 10 seconds, after which the fluorescence recovery in the cell is measured. B) Quantification of the FRAP results showing the relative fluorescence intensity change around the time when the cell is photobleached.

