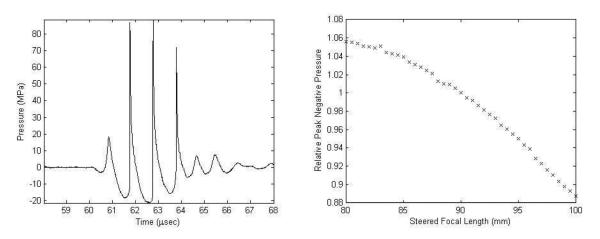
Figure 3.

Pressure calibration plots for the therapy transducer. a) Pressure waveform for a 3-cycle pulse at the output pressure level used in vitro and measured at the geometric focus (90 mm). b) Peak negative pressure over the axial steering range relative to that at the geometric focus.
