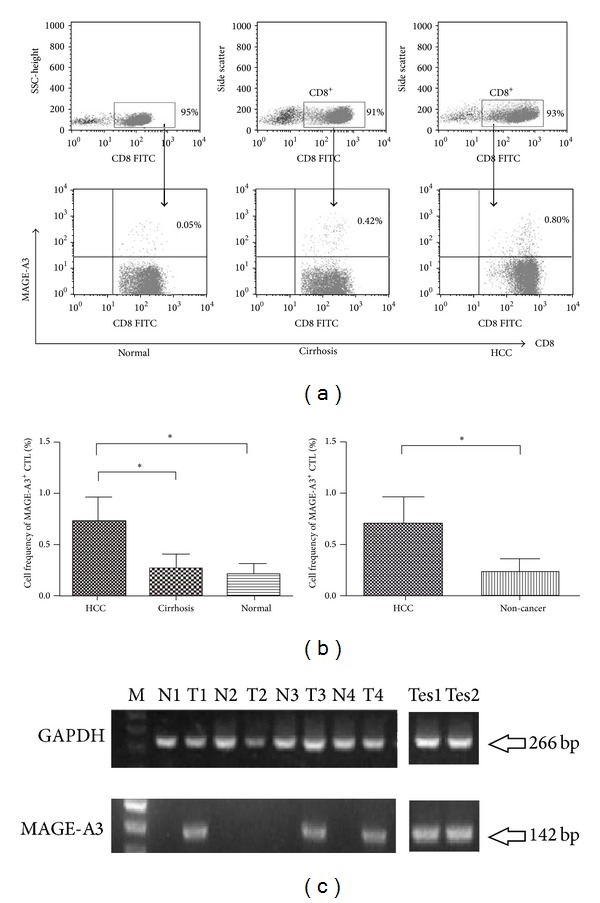
Figure 1.

(a) Frequency of MAGE-A3-specific cytotoxic T lymphocytes (CTLs). The percentages of CD8+MAGE-A3+ CTLs in CD8+ T-cell populations from HCC patients (n = 85), liver cirrhosis patients (n = 38), and healthy controls (n = 50). The results shown are representative of at least three independent experiments; P < 0.001. (b) Histograms of the frequency of MAGE-A3+ CTLs in the HCC group, liver cirrhosis group, and healthy controls. Box bars show the differences in frequency among the three groups (one-way ANOVA, P < 0.001). The data are presented in two groups: the cancer group, and non-cancer control group (independent t-test, P < 0.001). *P < 0.05. (c) MAGE-A3 mRNA expression in hepatocellular carcinoma (HCC) and adjacent non-cancerous tissues and testis tissues. GAPDH was used as internal control. M: 100 bp ladder marker; T: tumor; N: adjacent tissue; Tes: testis tissue.
