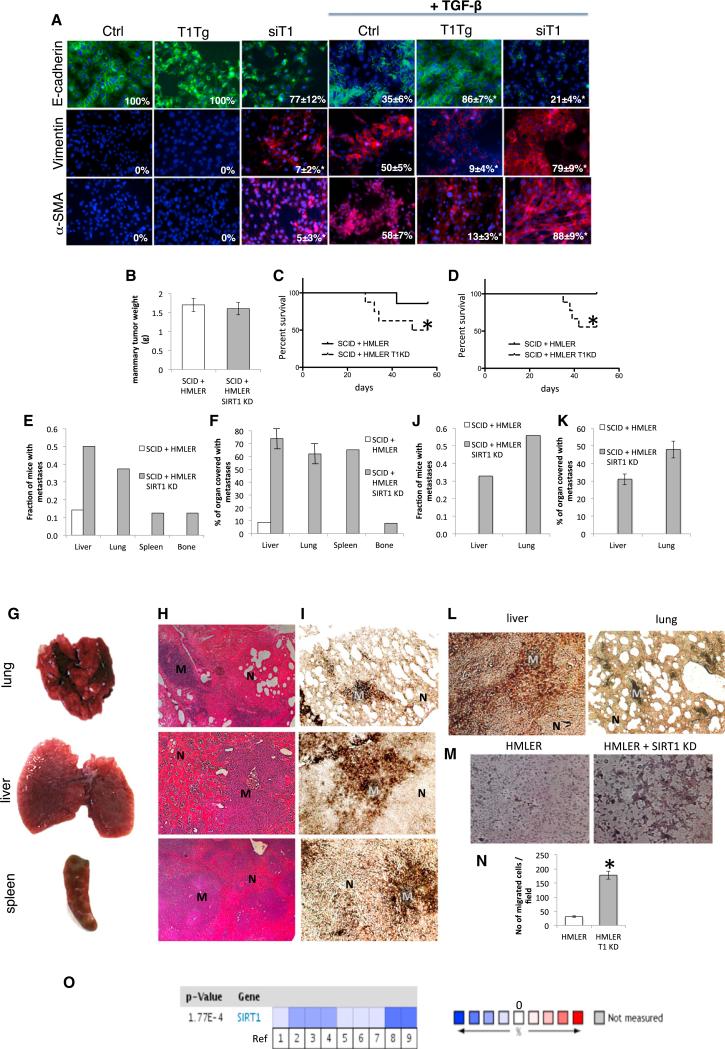
Figure 1. The Role of SIRT1 in EMT of Breast Cancer Metastases.
(A) Immunofluorescence staining of HMLER cells with E-cadherin, vimentin, and α-SMA 8 days following the treatment with TGF-β 5 ng/ml (63× magnification, DAPI staining of nuclei). Numbers in the bottom-right corners of images represent percentage of E-cadherin, vimentin, and α-SMA-positive cells over total number of cells per slide (n = 3 slides per group), shown as average ± SD, *p < 0.05, ANOVA Dunnett test, versus Ctrl treated with TGF-β; T1Tg, HMLER cells overexpressing SIRT1; siT1, HMLER cells with knockdown for SIRT1; Ctrl, control HMLER cells.
(B) Orthotopic mammary tumor weight following the termination of experiment.
(C and D) Survival of SCID mice up to 8 weeks (trial 1, left) and 7.5 weeks (trial 2, right) following the implantation of HMLER control and HMLER SIRT1 KD cells.
*p ≤ 0.05 log-rank test versus HMLER control cells.
(E) Fraction of mice with metastases in different organs 8 weeks following the implantation of HMLER control cells and HMLER SIRT1 KD cells (trial 1).
(F) Quantification of total organ metastasis burden (trial 1). Bars represent SD.
(G) Representative macroscopic images of mouse lung, liver, and spleen with visible metastatic nodules after implantation of HMLER SIRT1 KD cells in SCID mice.
(H) Hemalaun-eosin staining of mouse lung, liver, and spleen sections. M, metastatic nodule; N, normal tissue.
(I) Representative immunohistochemical staining of sections with anti-large T antibody from the same set of organs. M, metastatic nodule; N, normal tissue.
(J) Fraction of mice with metastases in different organs 7.5 weeks following the implantation of HMLER control cells and HMLER SIRT1 KD cells (trial 2).
(K) Quantification of total organ metastasis burden (trial 2). Bars represent SD.
(L) Representative immunohistochemical staining of sections with anti-large T antibody from the liver and lung (trial 2). M, metastatic nodule; N, normal tissue.
(M and N) HMLER and HMLER SIRT1 KD cells were induced to move and invade through Matrigel-coated transwell membranes. After 16 hr, the migrated cells were fixed, stained, and photographed. Representative photographs of transwell membranes showing stained migrated cells. (M) Quantification of (N) done by counting the number of migrated cells. Columns, mean of triplicate assays; bars, SD; *p < 0.05, t test.
(O) Meta-analysis of SIRT1 expression of 12 breast cancer clinical trials using Oncomine database (cutoff for significant SIRT1 change was p = 0.01). Blue quadrants represent downregulation of SIRT1 and red upregulation. References are in Table S1.
See also Figure S1.

