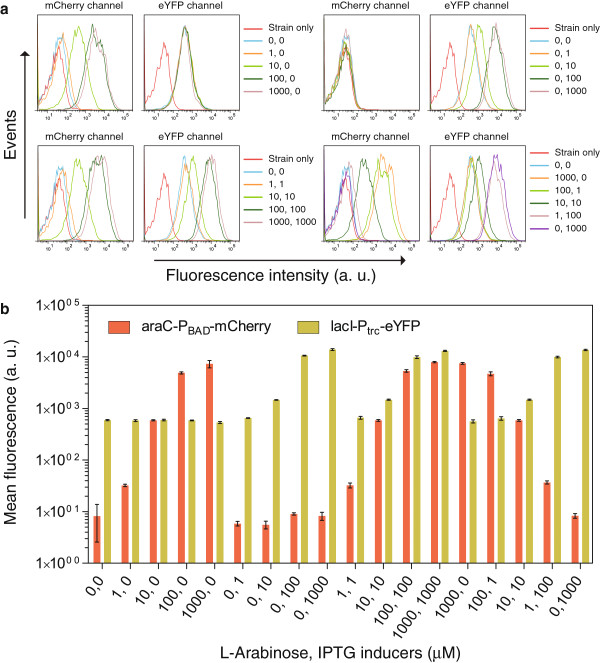
Figure 2.
Gradual and independent induction of AraC and LacI. (a) Histograms showing the single-cell fluroscence intensities (arbitrary units) as measured by flow cytometry, using the engineered MK01 strain. The strain harbored two plasmids expressing mCherry and eYFP fluorescent reporters under the control of the AraC and LacI respectively. The concentrations of the inducers, L-Arabinose and IPTG used in each conditions are indicated. One representative replicate from the multiple replicates is shown for each conditions. (b) The mean fluorescence intensities of the data displayed in panel a. The error bars indicate the std. dev. of 3–5 replicates. Other labels are as for Figure 2a.

