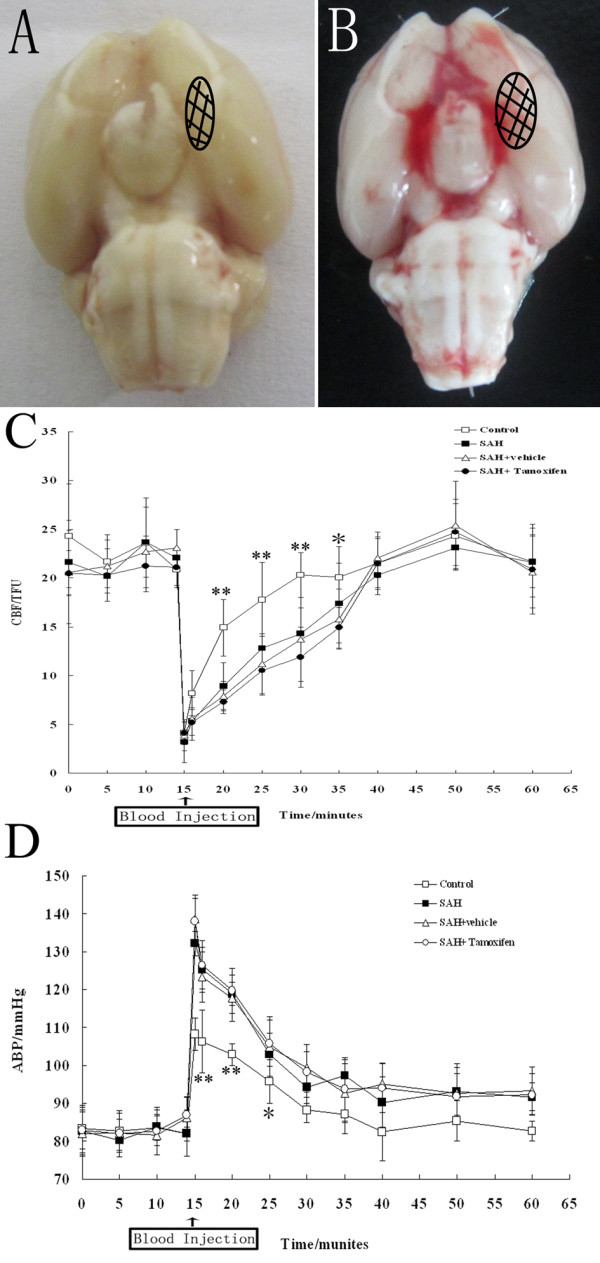
Figure 2.

Schematic representation of the analyzed area induced by subarachnoid hemorrhage (SAH). (A) control group and (B) SAH group. C and D: The time course of cerebral blood flow (CBF) and mean arterial blood pressure (MABP) in control group (n = 18), SAH group (n = 18), SAH + vehicle group (n = 18), and SAH + tamoxifen group (n = 18). (C) Graphs of CBF in middle cerebral artery (MCA) area measured by continuous laser Doppler flowmeter over the left hemisphere. (D) Secondary to injection of saline or blood, MABP increased sharply in all four groups. *P <0.05 and **P <0.01 between control animals versus SAH animals.
