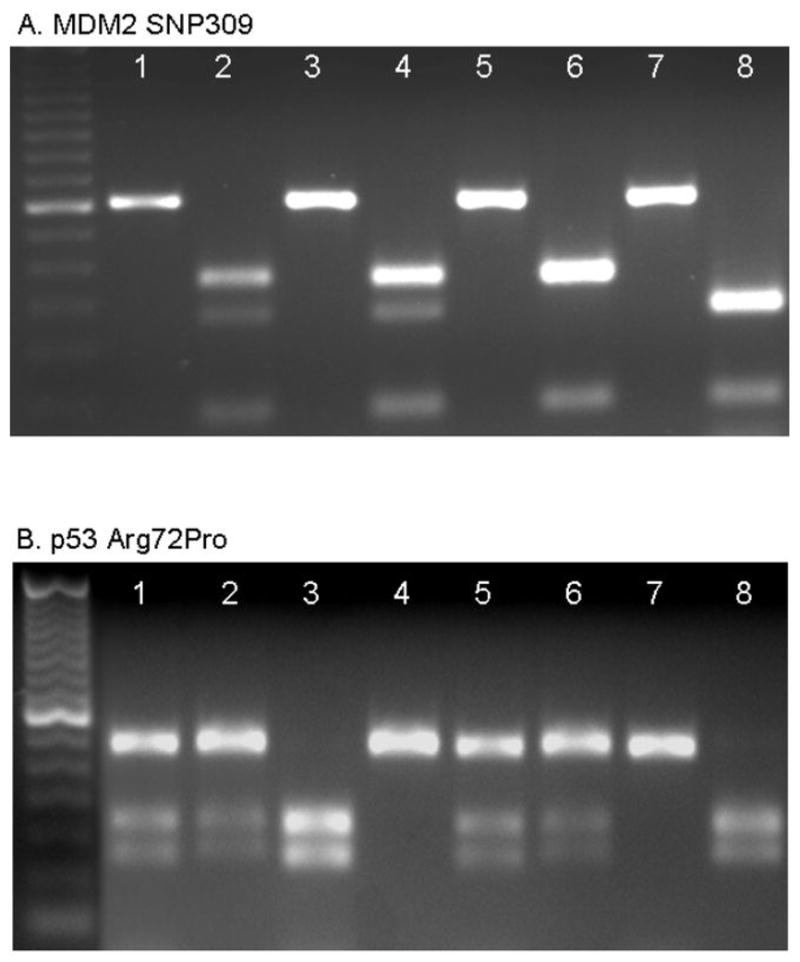
Figure 1. PCR-RFLP analysis of SNP309 and Arg72Pro genotypes.

Each pair of lanes (e.g., 1+2, 3+4, etc.) represents the analysis from a single patient. A 50 bp ladder (left-most lane) was used to distinguish band size. A. MDM2 SNP309. Odd lanes were loaded with PCR products, and even lanes with the products of an MspA1I digest. One upper band (233 bp) represents the TT genotype (lane 6), two bands (233 and 187 bp) represent the TG genotype (lanes 2 and 4), and one lower band (187 bp) represents the GG genotype (lane 8). B. p53 Arg72Pro. Odd lanes were loaded with the products of the BstUI digest; even lanes with the products of the BtgI digest. In odd lanes, one upper band (296 bp) represents the PP genotype (lane 7), three bands (296, 169, and 127 bp) represent the RP genotype (lanes 1 and 5), and two lower bands (169, 127 bp) represent the RR genotype (lane 3). In even lanes, one upper band (296 bp) represents the RR genotype (lane 4), three bands (296, 169, and 127 bp) represent the RP genotype (lanes 2 and 6), and two lower bands (169, 127 bp) represent the PP genotype (lane 8).
