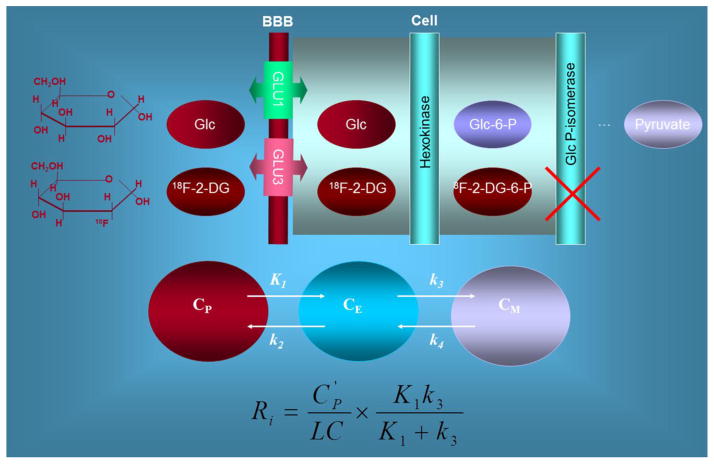
Figure 2. Theoretical basis of FDG method of measuring local cerebral glucose utilization using a compartmental model.
FDG and glucose (Glc) compete for the carriers that transport both between plasma and tissue (GLU1 and GLU3) and across the blood brain barrier (BBB), and for the hexokinase enzyme that phosphorylates them to their respective hexose 6-phosphates (Glc-6-P and 18F-2DG-6-P). The dashed arrow represents the possibility of glucose-6-phosphate (Glc-6-P) hydrolysis by glucose-6-idromerase activity, in which case the molecule proceeds down the glycolytic pathway to pyruvate. 18F-FDG-6-P is not further oxidized and remains trapped in tissue.
In the theoretical model, CP represents the total concentration of glucose in arterial plasma, CE represents glucose concentration in the precursor tissue pool that serves as substrate for hexokinase, and CM represents glucose concentration in tissue. The constants K1, k2 and k3 represent the rate constants for carrier-mediated transport of glucose from plasma to tissue, for carrier-mediated transport of glucose back from tissue to plasma, and for phosphorylation by hexokinase, respectively. The same model is applied to FDG. The metabolic rate of glucose (Ri) is estimated as a function of FDG concentration in plasma (CP′), the lumped constant (LC), and the metabolic rate of FDG [(K1 × k3)/k2+k3)].
While the three-compartment model includes four rate constants, it is often simplified by assuming that the dephosphorylation rate of FDG-6-phosphate in brain tissue (k4) is so low that it can be ignored (k4=0) over a standard acquisition time of 60 minutes post injection. k4 was not therefore included in the equation at the bottom.

