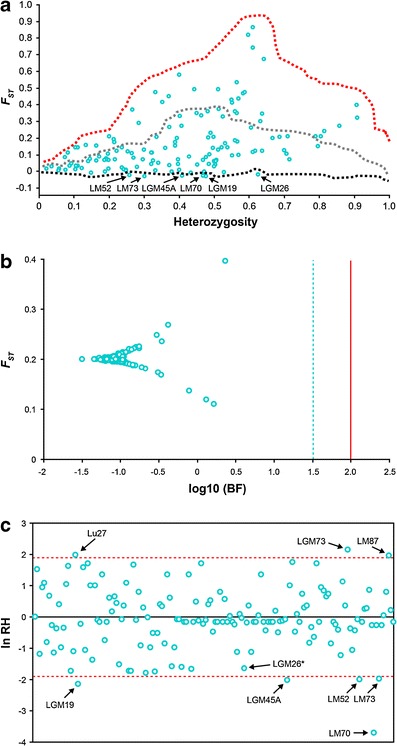
Fig. 1.

SSR neutrality tests in the three STRUCTURE sub-populations. a LOSITAN: distribution of empirical F ST values is shown as a function of expected heterozygosity. The upper and lower dashed lines indicate the 99 and 1 % confidence limits, respectively. The intermediate dashed line depicts the median value. b Bayescan: distribution of log-transformed Bayes factors and locus specific F ST. The dashed and solid lines indicate log10 BF of 1.5 and 2 corresponding to posterior probabilities of locus effects of 0.97 and 0.99, respectively. c Standardized ln RH: comparison between STRUCTURE sub-populations II and III. Dashed lines represent the 95 % confidence interval
