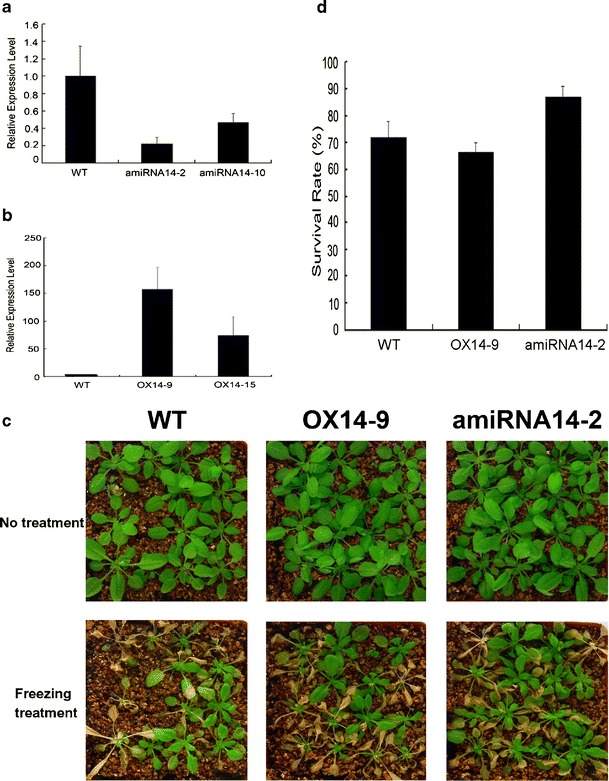
Fig. 5.

Increased freezing tolerance of the AtMYB14 knock-down lines. a Real-time quantitative PCR analysis of relative AtMYB14 transcript levels in amiRNA14 lines; the expression level of AtMYB14 in wild type plants was set to 1.0. b Real-time quantitative PCR analysis of relative AtMYB14 transcript levels in OX14 lines; the expression level of AtMYB14 in wild type plants was set to 1.0. c Freezing test carried out using wild type, OX14-9 and amiRNA14-2 plants. All plants were grown in soil at 22 °C for 3 weeks and then transferred into a freezing chamber at −1 °C. The chamber cooled at the rate of −1 °C/h, then held at −8 °C. After exposed to −8 °C for 2 h, plants were transferred to a greenhouse at 22 °C. After 7 days, the plants were photographed. d Survival rates of amiRNA14-2 and OX14-9 were analyzed on the 7th day after the freezing test. Error bars SD of biological replicates (n = 3)
