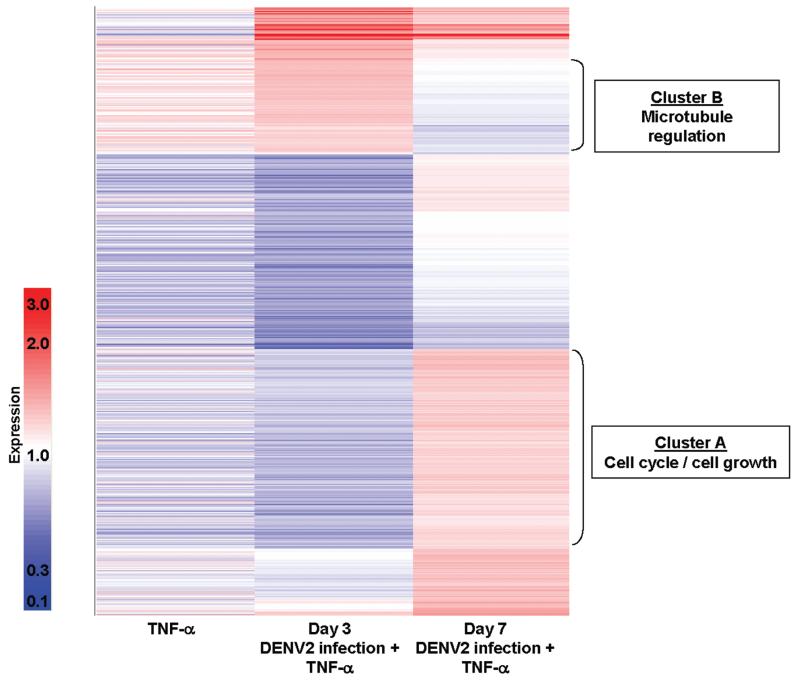
Figure 4.
Differential cellular gene expression in tumor necrosis factor (TNF)–α–stimulated human umbilical vein endothelial cells (HUVECs) between days 3 and 7 after dengue virus type 2 (DENV2) infection. Equal amounts of cellular RNA from 4 replicate experiments were pooled for each condition. Affymetrix HG-Focus arrays were used to select the genes that were expressed at levels differing by at least 1.25-fold between days 3 and 7 (a total of 1416 genes). These genes were organized by hierarchical cluster analysis using a Pearson correlation metric. Colors indicate the relative changes in induction (dark red represents 3-fold up-regulation, white represents no change, and dark blue represents 10-fold down-regulation). All signal values are normalized to the mock-infected HUVEC condition. The left column shows mean values for HUVECs stimulated overnight with recombinant (r) TNF-α (1 ng/mL) at 3 and 7 days after mock infection. The middle and right columns show the signal values for HUVECs stimulated overnight with rTNF-α (1 ng/mL) at 3 and 7 days after DENV2 infection (multiplicity of infection, 0.5), respectively. Gene ontology analysis for the genes contained in clusters A and B was conducted as described in Methods.

