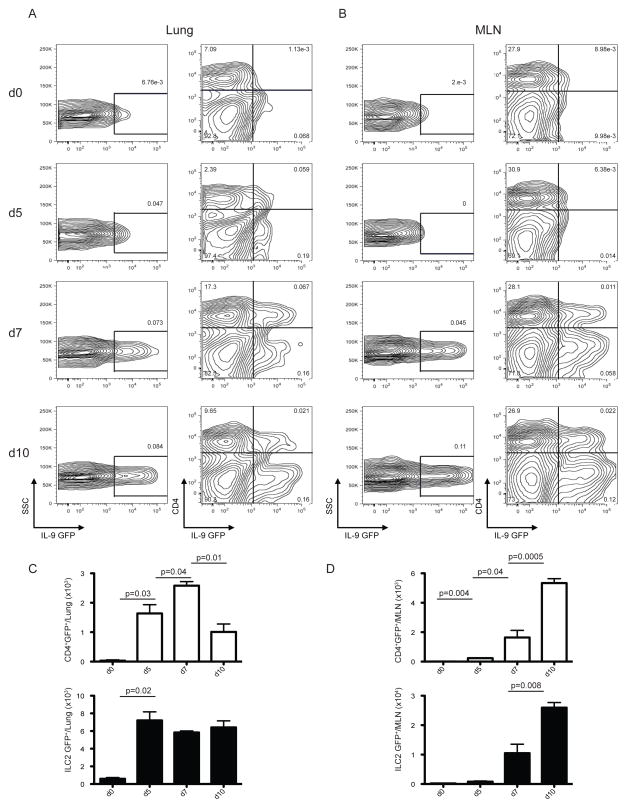
Figure 4. IL-9 is expressed in CD4+ T cells and ILC2 cells during N. brasiliensis infection.
INFER mice were subcutaneously infected with 625 L3 N. brasiliensis larvae. Lung (A) and MLN (B) was harvested and homogenized at different days p.i for assessment of IL-9 expression by flow cytometry. Numbers represent the frequencies of total GFP+ cells (left column) or GFP+ among CD4+ T cells (right column).
Total numbers of CD4+ T cells (white bars) and ILC2 cells (black bars) expressing IL-9 (GFP+) in lung (C) or MLN (D) of INFER infected mice as determined by flow cytometry.
Data are represented as mean +/− SEM from one out of three independent experiments with 3–4 mice per day p.i. The p values determined by unpaired two-tailed Student’s t test between days are shown.

