
Figure 4.
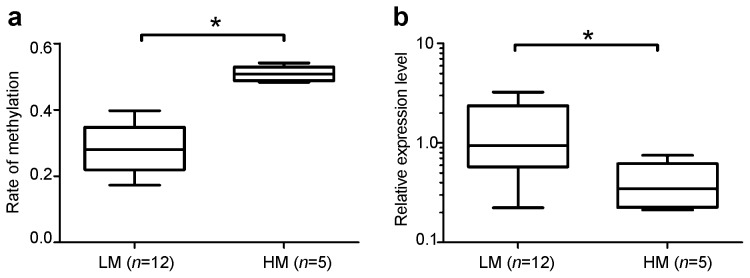
Classification of high- and low-methylation TDMR groups in patients with hypospermatogenesis. (a) Box–Whiskers plot (min. to max.) of patients with hypospermatogenesis subdivided according to the GTF2A1L methylation rate: low methylation (LM, n=12) and high methylation (HM, n=5). (b) The relative expression level of GTF2A1L in patients with hypospermatogenesis and low methylation (LM, n=12) or high methylation (HM, n=5). The asterisk indicates a statistically significant difference between values (P<0.05). TDMR, tissue-specific differentially methylated region.