
Figure 5.
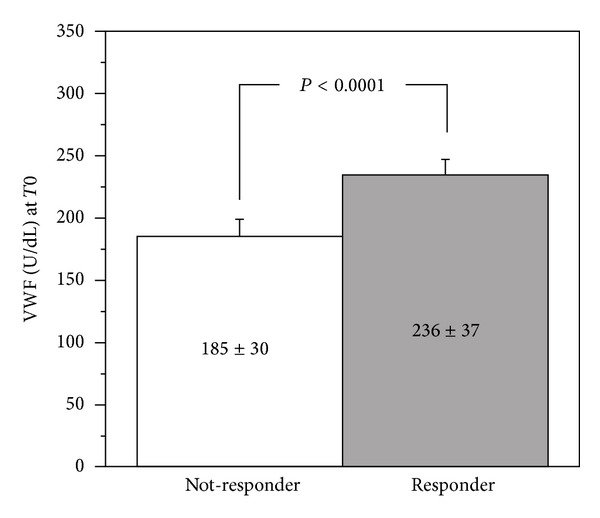
Correlation of delta of CEPI-CT (T1−T0) to basal levels of VWF and ADAMTS-13.
Official websites use .gov
A
.gov website belongs to an official
government organization in the United States.
Secure .gov websites use HTTPS
A lock (
) or https:// means you've safely
connected to the .gov website. Share sensitive
information only on official, secure websites.
Correlation of delta of CEPI-CT (T1−T0) to basal levels of VWF and ADAMTS-13.