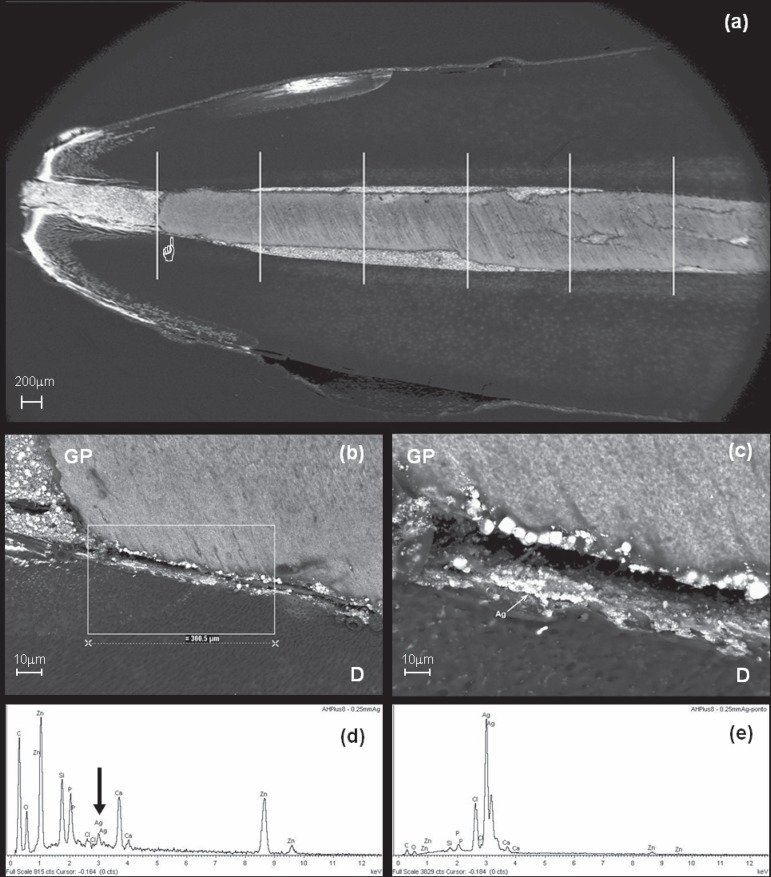
Figure 1.
Scanning electron microscopy (SEM) micrographs using back scattered electrons (BSE) mode and corresponding energy dispersive spectroscopy (EDS) spectrum of AgNO3 leakage: (a) - The apical 5 mm of the root canal filling divided into 1 mm-regions. Pointer at the detected metallic silver; (b) – area (300µm2) scanned for the existence of silver and respective EDS spectrum (arrow) and (c) - in detail, punctual EDS confirmation of its exact location. GP=Gutta-percha; D=Dentin

