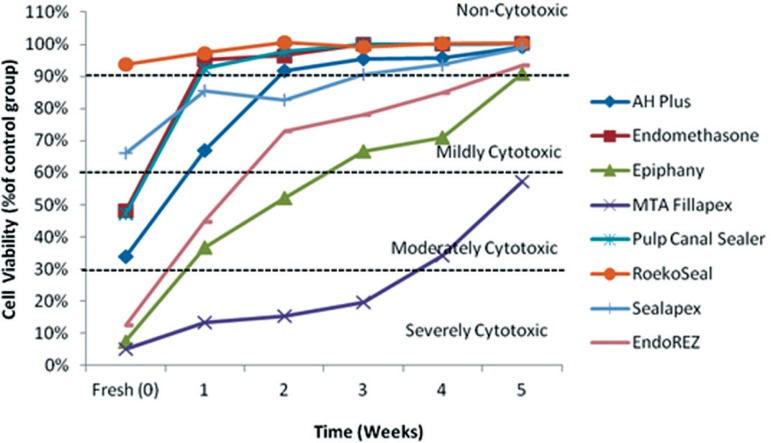
Figure 2.
Line chart depicting the changes in cell viability over time after the eight endodontic sealers were repeatedly immersed in a simulated body fluid. Values are expressed as percentages relative to the control group and classified as severe (<30%), moderate (<60%), mild (60-90%) or non-cytotoxic (>90%)

