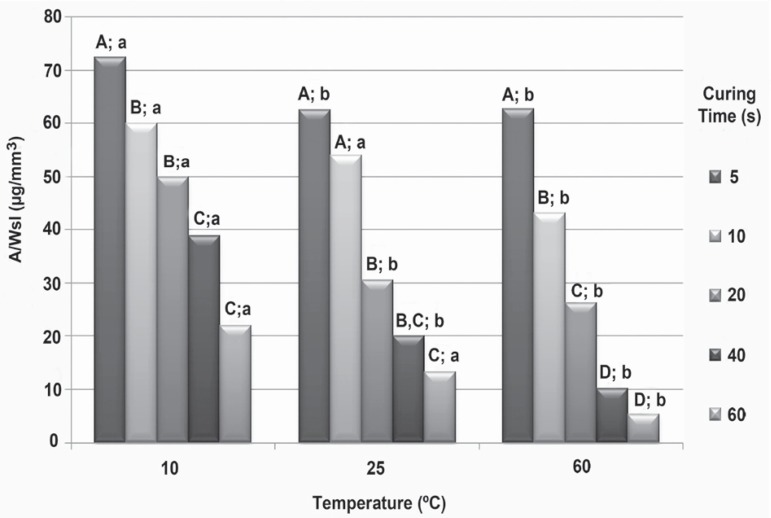
Figure 3.
Comparison among values of composite solubility cured at different times and temperatures using the Mann-Whitney U test. Different letters indicate statistically significant differences when comparing both curing times at each temperature (uppercase letters) and temperatures at each curing time (lowercase letters) (p<0.05)

