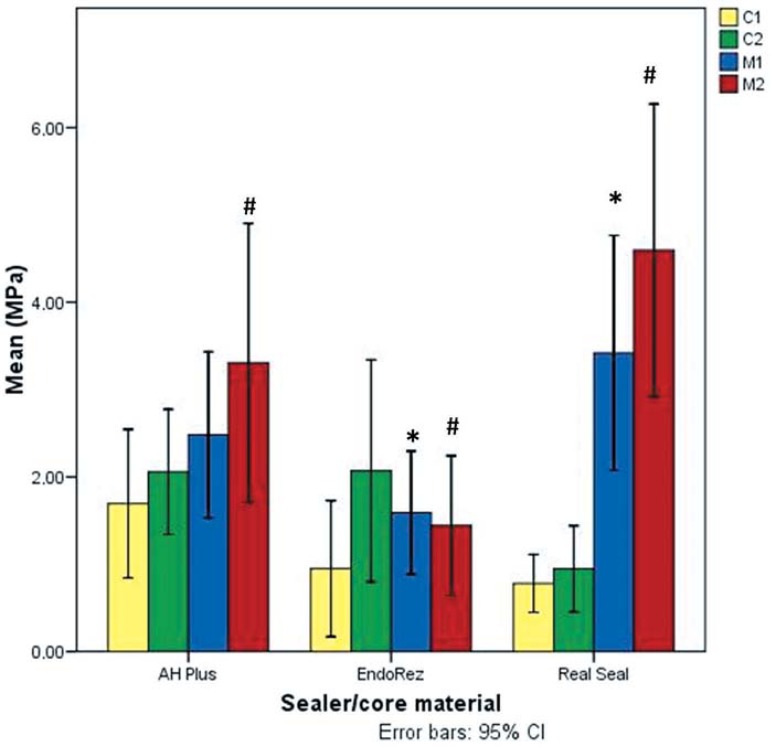
Figure 1.
Bar chart showing µPush-out bond strength values and comparisons among sealer/core materials in each root level (Mann-Whitney's U test)
*Significant differences among EndoREZ and Real Seal at M1 level
#Siginificant differences at M2 level: EndoREZ µPush-out was significantly lesser than the rest of sealer/core materials

