Figure 4.

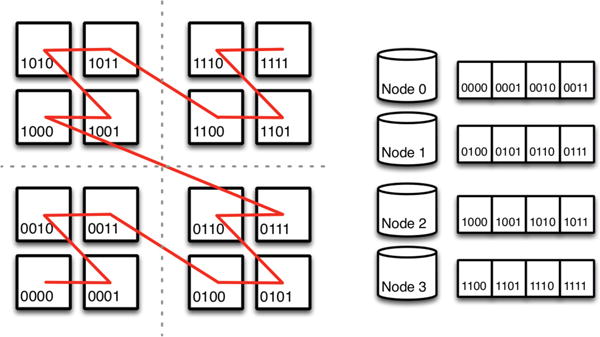
Partitioning the Morton (z-order) space-filling curve. For clarity, the figure shows 16 cuboids in 2-dimensions mapping to four nodes. The z-order curve is recursively defined and scales in dimensions and data size.

Partitioning the Morton (z-order) space-filling curve. For clarity, the figure shows 16 cuboids in 2-dimensions mapping to four nodes. The z-order curve is recursively defined and scales in dimensions and data size.