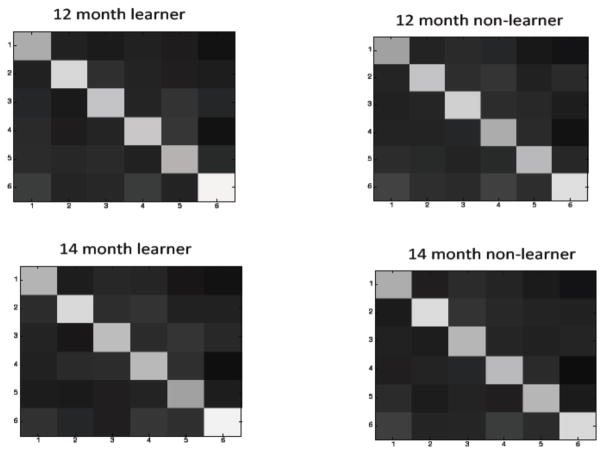
Figure 5.
Accumulated statistics for the four groups of participants calculated as in Yu and Smith (in press). Each cell represents the association probability of a word-object pair determined from the synchrony between a subject’s looking to an object at the presentation of a word. The diagonal items are correct associations and other non-diagonal items are spurious correlations. Dark means low probabilities and white means high probabilities.

