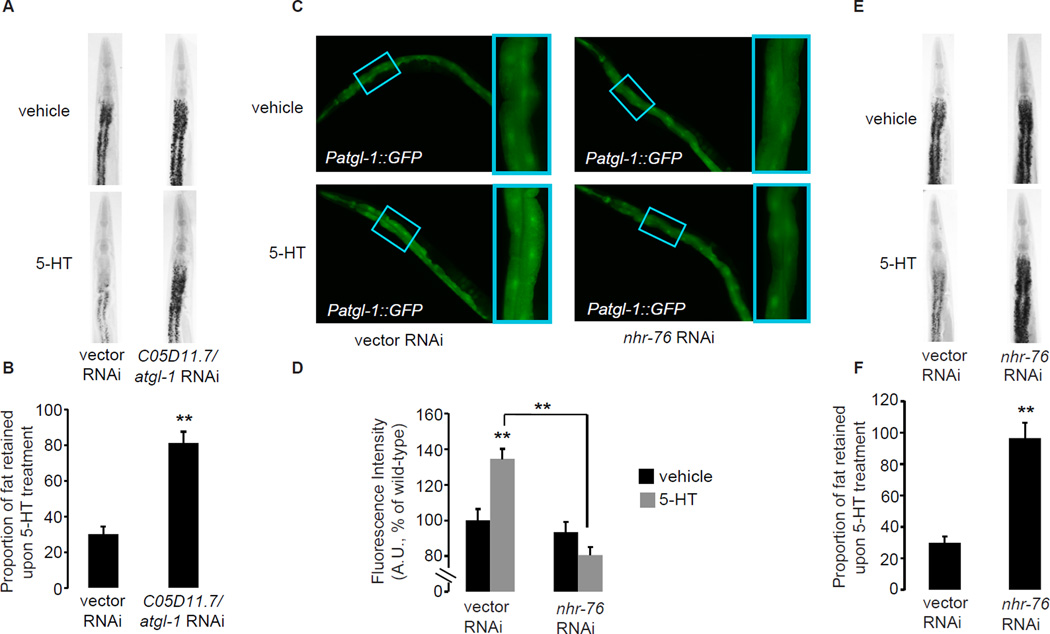
Figure 6. The conserved triglyceride lipase atgl-1 and the nuclear receptor nhr-76 control 5-HT-mediated fat loss in the intestine.
A, E. Representative images of vehicle (top row) or 5-HT (bottom row) animals fixed and stained with Oil Red O. B, F. The proportion of fat retained upon 5-HT treatment relative to vehicle treatment is shown for each condition (n=10–15). Data are expressed as a percentage of vehicle-treated wild-type animals ± S.E.M. **, p<0.005. C. Images of wild-type animals bearing an integrated atgl-1::GFP transgene exposed to vehicle (upper left panel) or 5-HT (lower left panel), compared to nhr-76-inactivated animals exposed to vehicle (upper right panel) or 5-HT (lower right panel). Inset, magnified view of region (third and fourth pair of intestinal cells) used for quantification. D. The fluorescence intensity of atgl-1 expression is quantified (see panel C inset) and expressed relative to control-treated animals ± S.E.M. (n=20–30). Black bars, vehicle treatment; gray bars, 5-HT treatment and **, p<0.005. See also Figure S4 and Table S1.

