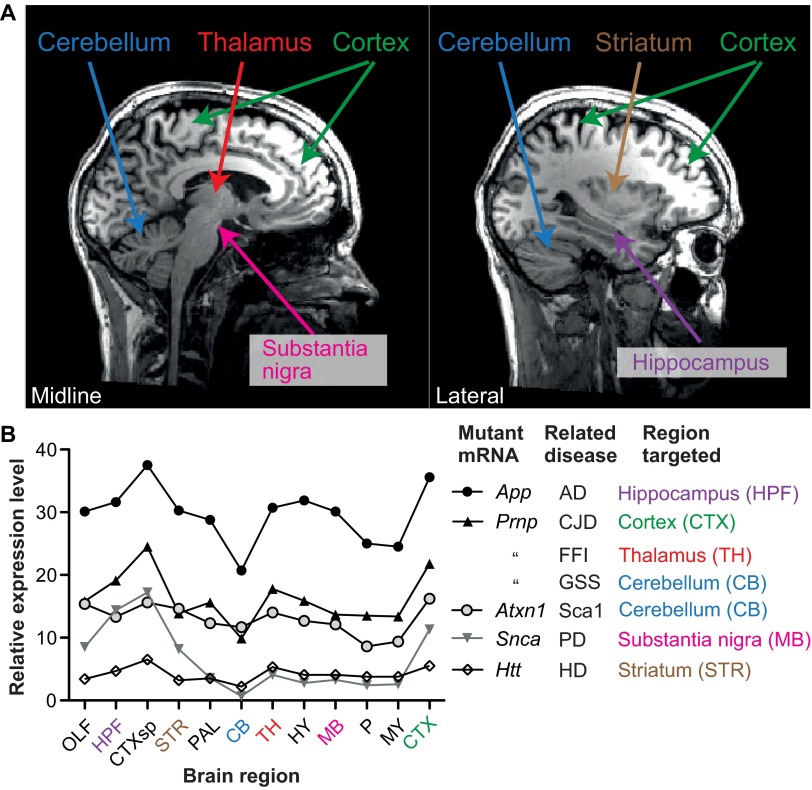
Fig. 1.
Different brain regions affected by different familial PrDs. (A) A powerful technique employed by neurologists to diagnose disease is to non-invasively look at a patient’s brain using magnetic resonance imaging (MRI). Two images in the sagittal plane from a healthy individual facing right are used as maps to indicate the regions affected in various neurodegenerative diseases and to highlight that the regions are widely distributed. The image on the left is at the mid-line, the other image is parallel but towards one side. (B) A line chart showing the spatial distribution of mRNAs that cause specific neurodegenerative diseases when mutated. These data were measured by in situ hybridization of the adult mouse brain. Expression levels are not appreciably higher in the areas that are targeted. Data were acquired from the Allen Brain Atlas website (www.brain-map.org). Brain region abbreviations: OLF, olfactory bulb; HPF, hippocampus; CTXsp, subregion of the cortex (bottom of the brain); STR, striatum; PAL, pallidum; CB, cerebellum; TH, thalamus; HY, hypothalamus; MB, midbrain; P, pons; MY, medulla; CTX, cortex (main region on top of the brain).

