Fig. 2.
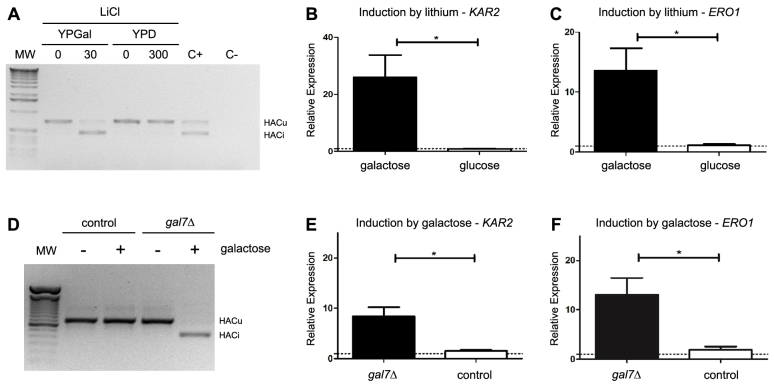
The UPR is triggered in the presence of galactose in both models of galactosemia. (A) The splicing of the HAC1 mRNA was followed by RT-PCR in control cells grown in medium containing either glucose (YPD) or galactose (YPGal) as the main carbon source, before (0) or after a 2-hour incubation with LiCl (30 or 300 mM). We treated cells growing in YPD with 300 mM LiCl instead of 30 mM used in YPGal because we could not detect any decrease in growth at lower concentrations when glucose was the main carbon source. C− indicates a PCR reaction without the addition of cDNA; C+ indicates a sample of yeast cells treated for 1 hour with 2.5 μg/ml of tunicamycin, a known inducer of UPR. MW, molecular weight marker. HACu indicates the product of the unspliced mRNA and HACi indicates the product of the spliced mRNA. A representative result of three independent experiments is shown. (B,C) Relative expression levels of KAR2 and ERO1 were determined by qRT-PCR from control cells grown in YPD or YPGal, in the presence or absence of lithium. Induction by lithium was calculated using the comparative Ct method and compared with the expression before and after the 2-hour incubation with lithium (300 mM in YPD and 30 mM in YPGal). Results are the mean ± s.d. of four independent experiments. (D) Splicing of the HAC1 mRNA was followed by RT-PCR from control or gal7Δ cells grown in YPGly medium and treated (+) or not (−) with 0.02% galactose for 2 hours. A representative result of three independent experiments is shown. (E,F) Relative expression levels of KAR2 and ERO1 were determined by qRT-PCR from control or gal7Δ cells grown in YPGly medium and treated or not with 0.02% galactose. Induction by galactose was calculated by comparing the expression before and after the 2-hour incubation period with galactose. Results are the mean ± s.d. of four independent experiments. *P<0.05, Student’s t-test.

