
Fig. 4.
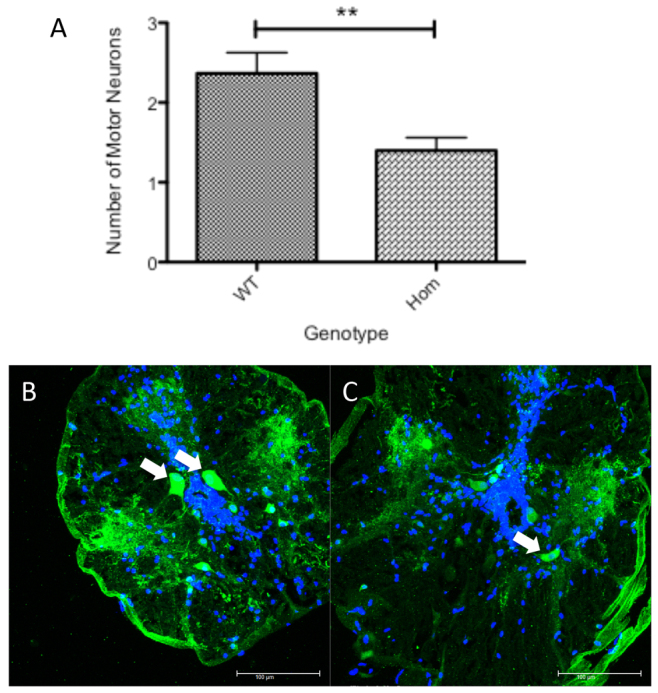
ChAT staining in adult zebrafish spinal cord. (A) Bar chart depicting the average number of large motor neurons with a cell body area of >200 μm2 per spinal cord section in homozygous T70I sod1 zebrafish and their WT clutch mates. n=120 per group (40 sections per fish; three fish used). Statistical significance was calculated using a two-tailed t-test. **P<0.01. (B,C) Confocal images of adult WT zebrafish spinal cord (B) and adult homozygous T70I sod1 zebrafish spinal cord (C) (ChAT, green; DAPI nuclei, blue). White arrows indicate ChAT-positive large motor neurons (>200 μm2). Scale bars: 100 μm.