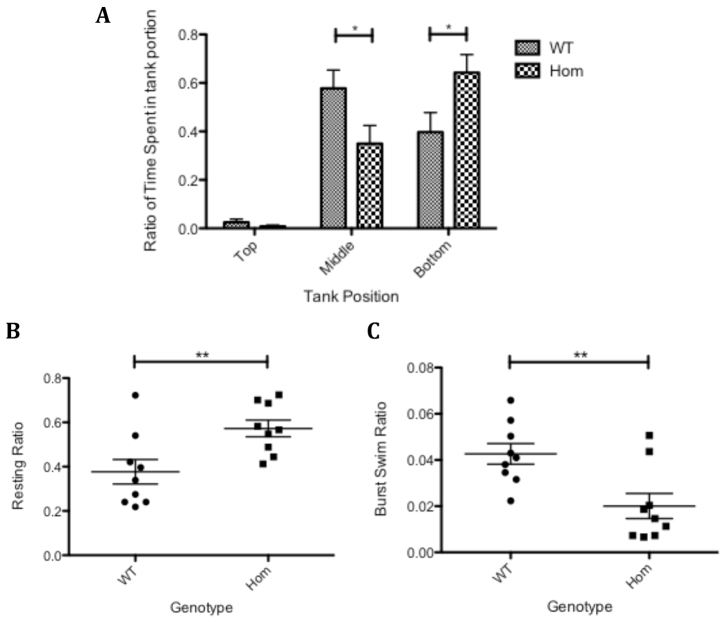
Fig. 5.
Movement analysis of T70I Sod1 adult zebrafish. (A) Bar chart depicting the ratio of time that 20-month-old adult zebrafish spent in a mean positional plane in a fish tank. n=10 for each group. Statistical significance calculated using one-way ANOVA and Bonferroni’s multiple comparison test. (B) Graph depicting the ratio of time that 20-month-old adult zebrafish spent in the ‘resting’ phase of swimming activity. Statistical significance was calculated using a two-tailed t-test. (C) Graph depicting the ratio of time that 20-month-old adult zebrafish spent in the ‘burst’ phase of swimming activity. Statistical significance was calculated using a two-tailed t-test. *P<0.05; **P<0.01.

