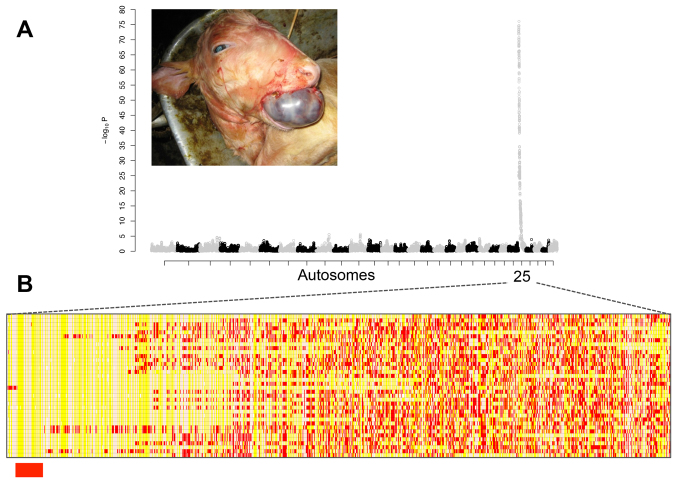
Fig. 2.
Genome-wide association mapping for the hamartoma disease locus. (A) Manhattan plot for case/control GWAS presenting a unique genome-wide significant signal on chromosome 25; the 29 autosomes are alternately labeled in gray or black. inset shows a typical hamartoma case. (B) Cases genotypes for 1256 chromosome 25 SNP; homozygous genotypes are shown in yellow or white, heterozygous genotypes in red; the centromeric 1.15-Mb homozygosity region, identical by state among all cases, is highlighted in red.

