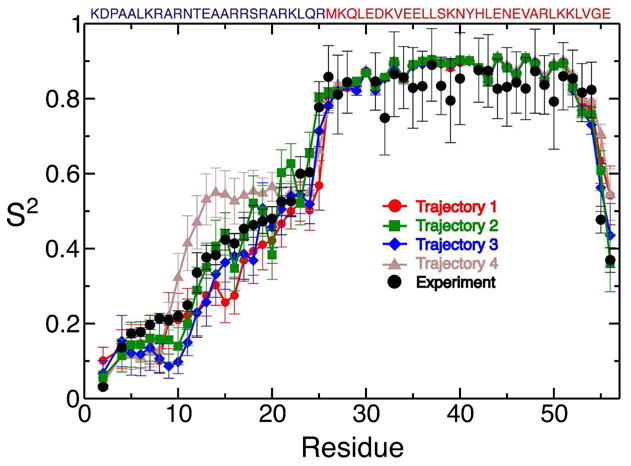
Figure 4.

Comparison of experimental and simulated generalized order parameters (S2) from four 100 ns MD simulations initiated from starting structures with varying degrees of helicity. Simulated S2 values were calculated after superposition of backbone atoms of the leucine zipper (residues 26-54). Error bars of the simulated S2 values reflect the standard errors of the mean of each residue for five 18.9 ns analysis blocks. The sequence of the GCN4 bZip domain is displayed above the graph with residues in the basic region colored blue and residues in the leucine zipper colored red.
