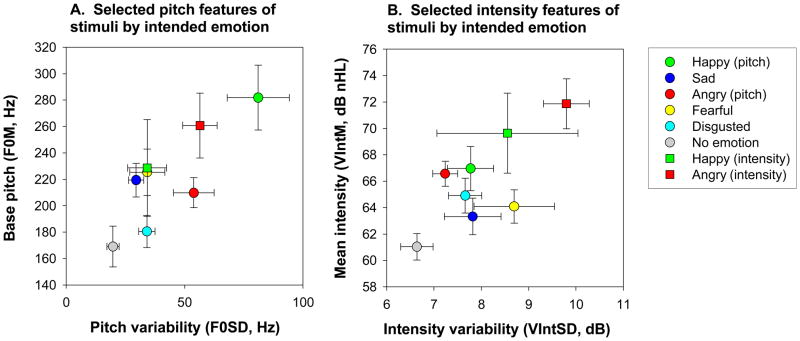
Figure 1. Map of stimuli included in the full battery on mean base pitch (F0M) and pitch variability (F0SD) (A) and mean intensity-(VIntM) and intensity variability (VIntSD) (B).
Variability in feature by pitch-based stimuli was determined by one-way ANOVAs across emotions. Among stimuli that were considered to be pitch-based, there was significantly variability in mean base pitch (F0M, p<.0001) and pitch variability (F0SD, p<.0001) but not mean voice intensity (VIntM, p=.13) or intensity variability (VIntSD, p=.4) (shown). Other variables (not shown) that showed significant variability across emotions were the floor frequency of the base pitch (F0floor, HF500 (p=.01), mean pitch of p=.04), maximum frequency of the base pitch (F0max, p<.0001), pitch contour (F0contour, p=.02) and mean pitch of the first formant (F1M, p=.006). A discriminant function analysis with pairwise comparison demonstrated significant contribution of several pitch variables, including F0SD, F0Max, maximum frequency of the first formant (F1Max), and F0Contour differentiation of emotional stimuli. Neither VIntM or VIntSD contributed significantly to this discriminant function. When intensity-based stimuli as a group were compared to pitch-based stimuli, VIntM (p=.001), VIntSD (p=.004) (shown), and HF500 (p<.0001), and mean bandwidth of the first formant (F1BW) (p=.011) (not shown) were significantly different across stimuli. In contrast, pitch-based measures including F0M (p=.008) amd F0SD (p=.27) were not different. A discriminant function showed significant contribution only of VIntM to differentiation of intensity- vs. pitch-based stimuli, with no further contribution of other intensity- or pitch-based variables.

