
Figure 4.
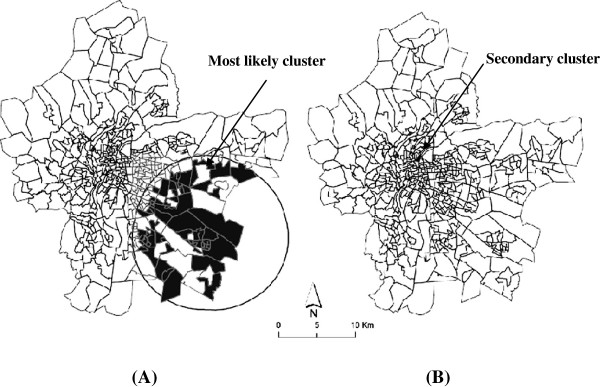
Mapping of the most likely cluster (A) and secondary cluster (B) of infant mortality. Legend: Dark area identify census block included in the most likely cluster. This means that the centroid for these blocks falls within the cluster.
Official websites use .gov
A
.gov website belongs to an official
government organization in the United States.
Secure .gov websites use HTTPS
A lock (
) or https:// means you've safely
connected to the .gov website. Share sensitive
information only on official, secure websites.
Mapping of the most likely cluster (A) and secondary cluster (B) of infant mortality. Legend: Dark area identify census block included in the most likely cluster. This means that the centroid for these blocks falls within the cluster.