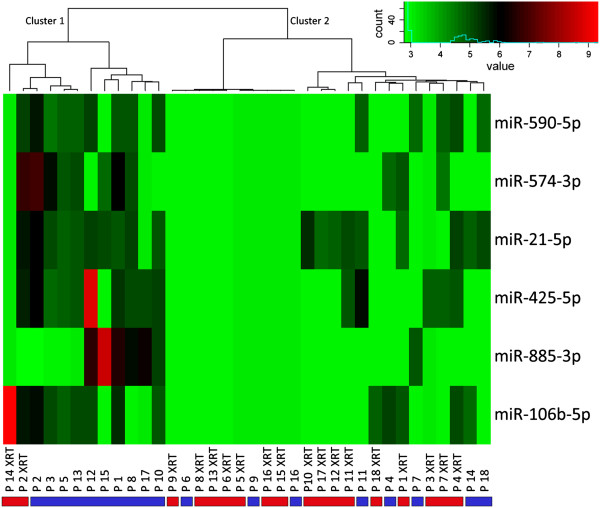
Figure 2.
Unsupervised hierarchical cluster analysis of samples collected before therapy and after two days of treatment. Samples collected prior to treatment are marked with blue bars, samples collected after two days of treatment (XRT = radiotherapy) are marked with red bars. Cluster 1 and Cluster 2 indicate the two main clusters emerging from unsupervised cluster analysis using blood plasma concentration levels of the top six distinctive miRNAs.

