Figure 1.
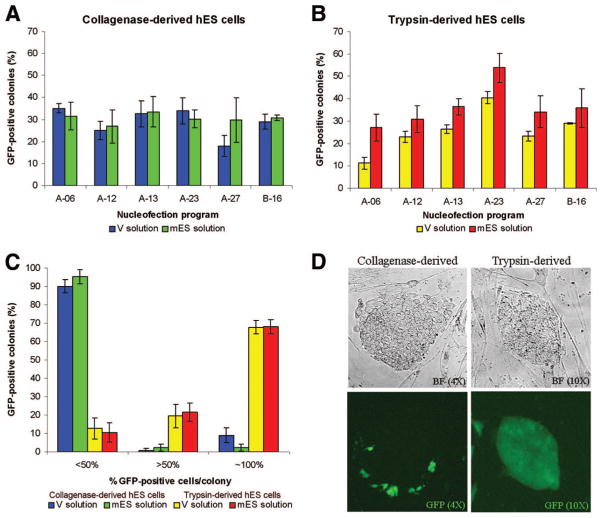
Optimization of nucleofection in hES cells. (A): The mean percentage of colonies (±SEM; n = 3) that were GFP-positive after nucleofection of collagenase-dissociated hES cells in V solution (blue bars) or mES solution (green bars). (B): The percentage of colonies (±SEM; n = 3) that were GFP-positive after nucleofection of trypsin-dissociated hES cells in V solution (yellow bars) or mES solution (red bars). (C): The mean percentage of GFP-positive cells (n = 5) in each colony after nucleofection of collagenase-derived (blue and green bars) and trypsin-derived (yellow and red bars) hES cells using program A-23 in either V solution (blue and yellow bars) or mES solution (green and red bars). (D): BF (top) and GFP expression (bottom) of transfected collagenase-dissociated hES cells and trypsin-dissociated hES cells 4 days after nucleofection. Abbreviations: BF, bright-field; GFP, green fluorescent protein; hES, human embryonic stem; mES, mouse embryonic stem.

