Fig. 4.

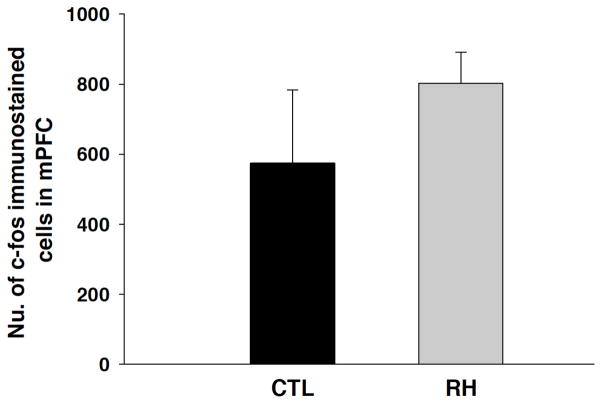
Fig. (4A). The mean (+ SEM) number of stained nuclei for c-Fos protein within the medial prefrontal cortex (mPFC) at the end of Set-Shift testing in control animals (CTL) and in animals induced with recurrent bouts of hypoglycemia on each of preceding 3 days of testing (RH). No significant differences were observed in the number of c-fos stained cells between the treatment groups.
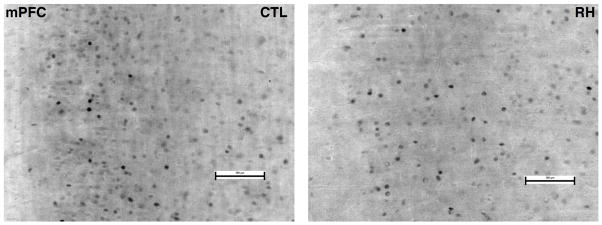
Fig. (4B). A representative medial prefrontal cortex (mPFC) c-Fos immunostaining from CTL and RH animals. Bar = 100μm.

