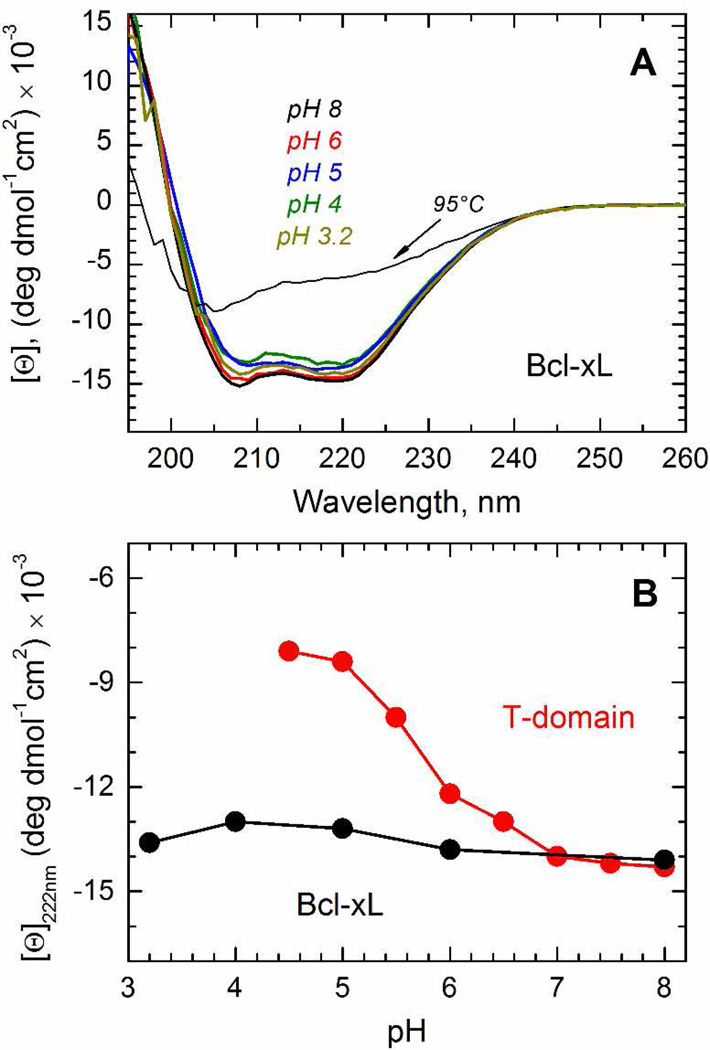
FIGURE 3.
Comparison of pH-dependent variation in secondary structure and thermostability of Bcl-xL and the T-domain in solution. A) CD spectra of Bcl-xL in solution at pH 8 (black spectrum), 6 (red spectrum), 5 (blue spectrum), 4 (olive spectrum) and 3.2 (dark yellow spectrum) at 25°C. The CD spectrum at pH 8 and 95°C is shown for reference (dotted line). B) pH-dependent changes in molar ellipticity measured at 222 nm for T-domain (open symbols, data reproduced from (45) for visual comparison) and Bcl-xL (solid symbols).

