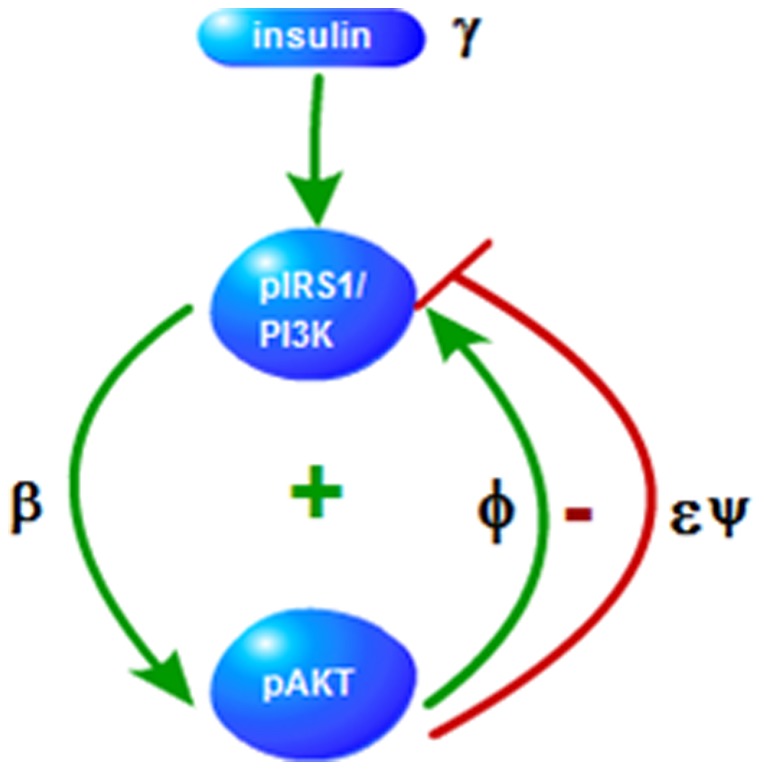
Figure 3. Insulin AKT Signalling Feedback Loops.

Signs + and − indicate positive and negative feedback loops, respectively. Parameters ( ) on the edges denote the strengths of the edges.
  is the nutrient level sensed my mTOR.

Signs + and − indicate positive and negative feedback loops, respectively. Parameters ( ) on the edges denote the strengths of the edges.
  is the nutrient level sensed my mTOR.