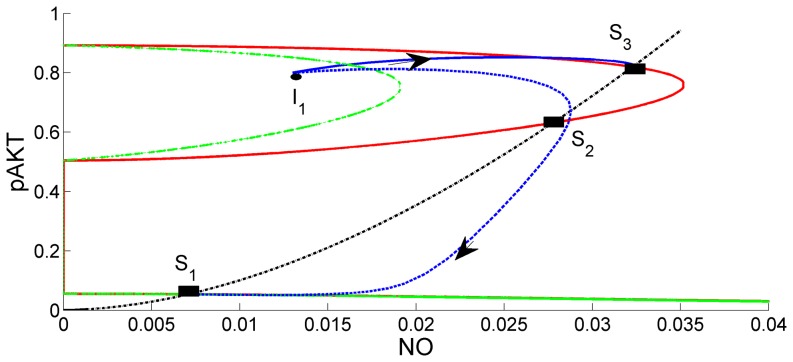
Figure 11. Comparison of Base Case (k7 = 0.1) with the Case k7 = 100.
Red curves are the steady-state curves for the base case (k7 = 0.1). Green curves are the same curves when k7 = 100. Intersections of red and green curves with the black define the steady-states for the two cases. Solid blue curve is the state trajectory for the base case. Dashed blue curve is the state trajectory for the case when k7 = 100. As the effect of Ang II is increased by increasing k7, the system loses bistability. Trajectories converge to the single steady-state S1 at low levels of pAKT and NO.

