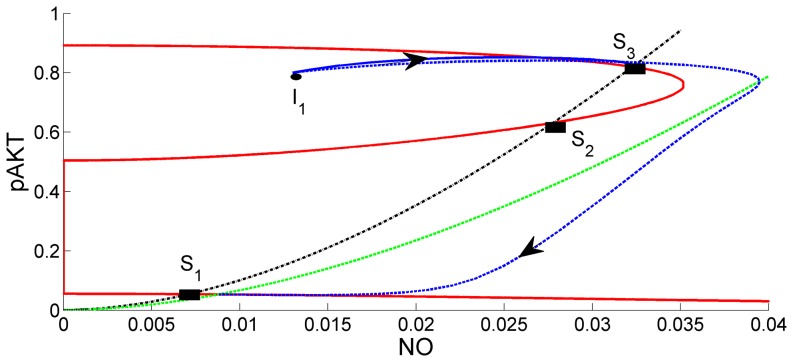
Figure 12. Comparison of Base Case (k4 = 0.01) and the Case k4 = 0.015.
Red curves are the steady-state curves for both cases. Black curve is the steady-state curve for the base case (k4 = 0.01). Green curve is the new curve when k4 = 0.015. Intersections of red curves with the black define the steady-states for the two cases. Solid blue curve is the state trajectory for the base case. Dashed blue curve is the state trajectory for the case when k4 = 0.015. NO production by pAKT is enhanced by Increasing the value of parameter  increases availability of NO and production of ONOO which impairs insulin signalling. Bistability is lost and the system settles to the single steady-state S1 where both pAKT and NO are low. In normal conditions (
 = 0.01), pIRS1-pAKT-pIRS1 and pAKT-NO-pAKT feedback loops work in coordination to maintain both insulin sensitivity and the right amount of NO by switching between S1 and S3 as necessary.

