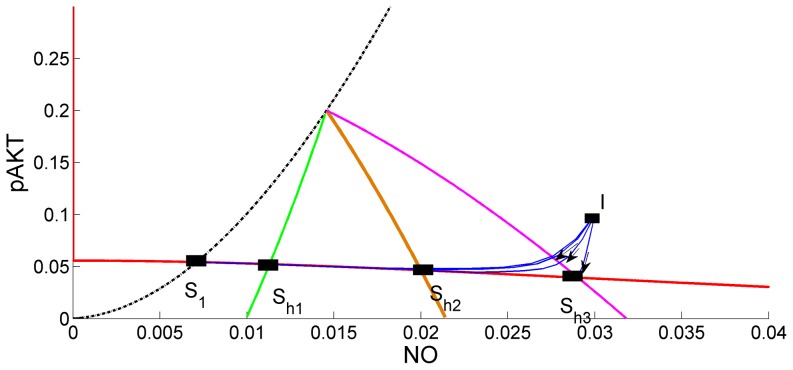
Figure 13. Effects of Hyperglycemia.
Points S1, Sh1, Sh2, Sh3 represent the steady-states. At these steady states NO levels increase as the parameter  or hyperglycemia effect increases. Black, green, brown and red curves for k9 = 0, 0.005, 0.02 and 0.04, respectively. Intersections of these curves with the low-pAKT steady-state curve (red) define the steady-states for different levels of hyperglycemia. Dynamic simulations starting from initial condition I converge to different steady-states. Solid blue curves are the state trajectories for different k9 values. pAKT stays below the threshold value 0.2 and increasing
  or hyperglycemia shifts the steady state to higher NO levels.

